 |
A MULTIVARIATE APPROACH TO CHARACTERISE THE GROOVE SHAPE OF THE LINEAR PARTS OF PETROGLYPHS. Franco Urbani Sociedad Venezolana de espeleología. Correo electrónico: urbani@cantv.net
Publicado originalmente en :Rock Art Research 1998 - Volume 15 . Number 1.
Abstract. A method based in the measurement of five variables of the grooves from Linear parts of petroglyph images allows the quantitative characterization of cross-sectional shape. With the data matrix several univariate and multivariate statistical techniques can be used to evaluate and classify such shapes and depending on the results, the rock art specialist will be to derive interpretations. Resumen: Se propone un método para la caracterización cuantitativa de la forma de las secciones transversales de los surcos de tramos lineares (rectos o curvos) de imagenes de petroglifos. Con la medición de cinco variables que definen la forma de la sección se obtiene una matriz de datos que puede ser procesada con técnicas estadísticas uni o multi variables, posterioremente, y dependiendo de los resultados obtenidos, el especialisat en arte rupestre podrá extraer las interpretaciones que considere apropiadas para cada caso particular.
INTRODUCTION The shape of the grooves of the linear sections of petroglyph images is usually studied by measuring depth. Width and qualitatively taking note of the shape: U or V shapes, symmetric, asymmetric etc. (Sujo 1975). In recent years much interest has arisen in the scientific study of the rock art, therefore several works have appeared suggesting techniques for its documentation (e.g.Milstreu 1996; Swantesson 1995). In some petroglyph panels containing several images made up mainly of engraved curved or straight lines, and not of wide low-relief parts, different images may show grooves with different sizes and shapes, therefore to quantitatively study and compare them, a statically multivariate data-processing approach developed which uses the measurement of five variables of the groove cross-section that reasonably characterises it.
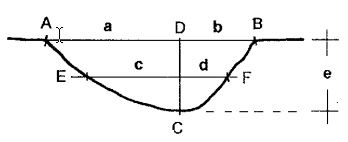
DATA ACQUISITION The basis of the method is to carefully record on paper in a 1:2. Scale several cross-sections of the different images whose grooves need to be characterized, preferably around ten or more cross-sections per image, depending on its size and complexity. Different workers, depending on what they have available, may use different methods to record the groove cross-sectional shape accurately. Two of them are: (a) A medium-hardening plastic moulding clay is applied with slight pressure on the groove and then carefully removed, and a section perpendicular to the rock surface is cut with a razor blade. This is then laid down on the note book and the shape of the groove is carefully followed, and traced with a very fine-pointed pen onto the paper with care. This measures can be obtained with an error of about 0.5mm. Since this method may leave unwanted residue on the rock it must be used only on petroglyphs that have been subjected to anthropic damage, e.g. that have already been painted. (b) By a comb-like tool used by machine and lathe operators that consist of a series of pins that move independently up and down, but parallel one to another, adapting to the shape of the object being examined. This tool comes in different sizes and the accuracy depends on the diameter of the individual pins. Once the tool has been applied perpendicular to the groove, the shape must be carefully traced onto the note-book with a fine-pointed pen. With the cross-sections recorded on paper, once at the office, the top line of each is defined from rim to rim and drawn as A-B , and the deepest point (C) is located (figure1).
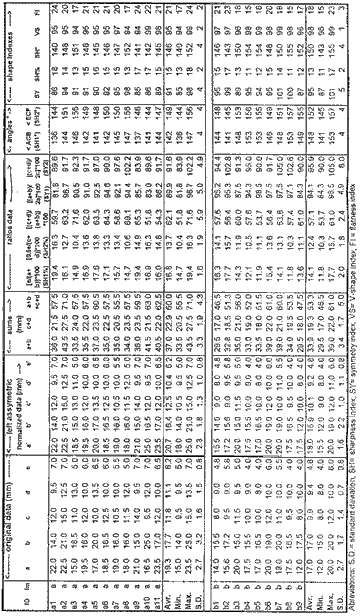
A line perpendicular to A-B, and reaching C is also drawn (C-D); the line E-F, parallel to A-B and at midpoint of the C-D line is defined. The distances a, b, c, d, and e are then measured and transferred to a PC spreadsheet computer program (e.g. Excel, Lotus, QPRO) (Table 1).
DATA PROCESSING Depending on the rock art worker and the research design, several mathematical and statistical calculations can be performed once the data table is available, as follows. Size characterisation With any spreads program the average , minimum, maximun and standard deviation can be calculated for each of the five variables, or any ratio between them (table2).
With the averages of the five variables the mean shape of the groove cross-section can be defined. Univariate statistical tests can be performed, comparing such variables from different images (e.g.the t-test).
Shape chracterisation Several parameters are proposed to characterise the shape of the groove. They will be named symmetry, sharpness, V-shape and flatness indexes. The explanations and formula deductions appear on the Appendix.
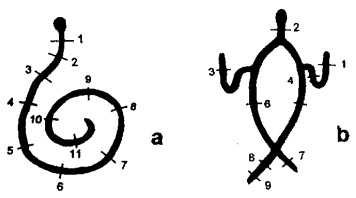
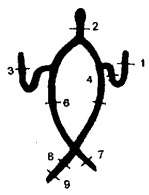
Multivariate statistics For the purpose of the proposed method, a suitable PC package to perform such statistical analysis is necessary. We have used Stratigraphics Plus© version 2.0 for Windows©. One of the most convenient and easy-to-interpret graphic methods is the Q-mode cluster analysis, a classification method that presents the relationship of different samples in a tree-like graph (dendrogram). Some examples of the use of this technique in anthropology are the study of the graphic elements of Venezuelan petroglyphs (Sujo 1978), classification of Roman lance point shapes (Orton 1988: 57), and Venezuelan bat-shaped pectoral plaques (Perera, 1976). Other statistical processing methods, such as discriminant functions or factor analysis, can also be performed. As an example, two petroglyph images are used from Piedra del Indio at Galindo Creek (Avila National Park, Caracas, Venezuela), carved in quartz- feldspar-biotite gneiss of Precambrian age. The rock is adjacent to the creek and erosive/ weathering agents seem to have acted in the same intensity on both images, Figure 2 shows both images schematically and the locations of the measured cross-sections.
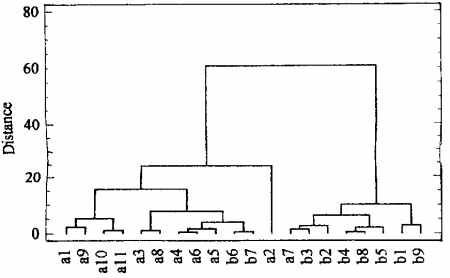
Figure 3 shows the Q-mode dendrogram obtained, using twenty samples (cross-sections) with five variables ( measurements a, b, c, d and e),and the left-asymmetric normalised data as explained in the Appendix.
It can be seen that the measured cross-sections are classified into two distinct clusters based on the phonetic distance coefficient -one with ten samples from image 2a and two of image 2b, and a second clusters with seven samples from image 2b and one of image 2a. This diagram and other statistical processing of the data matrix show that there is significant statistical evidence that the groove cross-sections of the two images studied are different. The multivariate analysis can be carried out with any of the following data sets: original, left-asymmetric normalised, or usin only ratios (Appendix, Table 2). The lefty asymmetric normalised data are preferred over the original data if only the sahpe of the cross-section is wanted to be taken in consideration, regardless its absolute size.
DISCUSSION With the univariate and multivariate data processing of the five measured variables as proposed above, the groove cross-sections of two example images form Piedra del Indio, Venezuela, are quantitatively characterise d as being significantly different. With these results it is up to the rock art worker to interpret the meaning of these data: do they relate to different ages, or to the images having been made by different human groups, perhaps using different tools and techniques; or have they been influenced by the rock type and its degree of weathering, etc. However, this is beyond the scope of the present note. The results could also be used for other purposes, such as image classification, weathering quantification, and others. The main limitation of this method is that it can be accurately used only on rather deep, linear, straigh or curved parts of petroglyphs, and not on the quite common wide low-relief parts of images. The author is willing to freely perform the statistical analysis to any worker if the data matrix is provided.
APPENDIX Proposed formulas for shape characterisation 1. Symmetry index :As can be seen in figure1, both the ratios a/b or c/d are measurements of the symmetry of the groove , so a value near 1 arises from fully symmetric shapes while departing values (greater or smaller than 1) will be shown by asymmetric shapes. Depending on the direction in which an asymmetric cross-section is looked at, it could be recorded as left asymmetric (a>b as figure 1) or right-asymmetric (b>a), therefore it is necessary to normalise the a, b, c, and d variables so that all the cross-sections be either left or right. We selected a left asymmetry for the normalisation. By normalising the data so that the a, b and c, d variables are always in the order so that the first one of each set is greater than the second, all the cross-sections will be either left-asymmetric. From variables a and b, we can name the larger dimension a' for of both situation and the smaller b'. The same is done with c and d, calling c' the larger and d' the smaller. Example:
Original data
Left-asymmetric normalised data
This new data matrix will be called left-asymmetric normalised data (table 2) The formulas are as follows: Symmetry 1 = SY1=[(a'+b')/2.a'].100 (1) Symmetry 2 = SY2=[(c'+d')/2.c'].200 (2) Symmetry index = SY = (SY1+SY2)/2 (3) In which a value of 100% represents the maximum symmetry attainaible while lower values represent lower symmetry. 2. Sharpness index: The ratios of widh to depth as (a+b)/e or (c+d)/1/2e represent the sharpness of the groove cross-section. Two ways proposed to characterise this property are: (1) As with symmetry, the following formula will give an estimate of the mean sharpness index (SH) in % units. Sharpness 1 = SH1 =[e/(a+b)].100 (4) Sharpness 2=SH2=[1/2e/(c+d)].100 (5) Shapness index (%)=SH%=(SH1+SH2)/2 (6). In which a value of 100% is given by a cross-section with the same values for width and depth. Values lower than 100% are for grooves with a width greater than depth which is the usual case, and values greather tha 100% are for sections with a greater depth than width, which the author has never seen in petroglyphs, or for very asymmetric grooves. In other words, low values represent low sharpness. (2) Another way to visualise the sharpness of a groove is to calculate the value of the angle at point C on the ideal triangle formed by the upper rims and the lower point (angle at C in triangle A-B-C,Figure1), but it can also be calculated for the middle triangle E-F-C. Therefore: Angle ACB=SH1° tg-1 (a/e) +tg-1(b/e) (7) Angle ECF= SH2°á=tg-1 (c/1/2e)+tg-1(d/1/2e) (8) Shapness index (°) =SH°=(SH1°+SH2°)/2 (9) To visualise the magnitudes of the numbers involved in the two methods of sharpness calculation, some examples are given for ideal V. cross-sections:
3.V-shape index: For a groove with a cross - section of ideal V-shape, the angles ACB and ECF would have to be the same. Since a perfec V-shape is very difficult to attain, the usual shapes found in the field will show different degrees ranging between V and U or curved shapes. An index of the departure of the V-shape could be devised by the comparison of the above angles: Angle ACB=SH1° (calculated by formula 7) Angle ECF=SH2° (calculated by formula 8 ) So the following formula can be used: V-shape index= VS= (SH1°/SH2°).100 (10) In which a value of 100% represents an ideal V-shape and lower values are more curved and U-shapes. 4.Flatness index : In grooves with a very flat bottom, the width measures (a+b and c+b) will be similar and much larger that the deph (e). Therefore the ratio of average of both width measures to the depth will be an index of the bottom flatness. [This index is not to be confused with the granulometric flatness indexes of Cailleux and Luttig. Ed.]. This parameter is similar to the sharpness index (formula 6). Flatness index=FL= 100.[2.e/(a+b+c+d)] (11) In which a 100% value will be produced for cross-sections in which width and depth are equal, and values lower for a flatter bottom.
REFERENCES MILSTREU.G.1996. Ducumentation and registration of rock art. Scandinavian society for prehistoric art, underslos. PERERA.M.A.1979. arqueologia y arqueometria de las placas liticas atadas del occidente de Venezuela. University Central Venezuela, Fac. cienc. Ecomom y soc. Caracas. ORTON,C.1988. Matematicas para arqueologos. Alianza Editorial,Madrid. SUJO VOLSKY.J.1975. El estudio del arte rupestre en Venezuela.Montalban 4:708-71 SUJO VOLSKY, J. 1978. Un experimento con la Univac. In E. Wagner and A.Zucchi (Eds). Unidad y variedad. Ensayos en homenaje aJose M. Cruxent, p.295-327. Edicion Centro de estudios Avanzados, Caracas. SWANTESSON, J. O. H. 1995. Detailed measurements of weathering on rock carving. Adoranten 1995: 18-21
—¿Preguntas, comentarios? escriba a: rupestreweb@yahoogroups.com— Cómo citar este artículo:URBANI, Franco. "A multivariate approach to characterise the groove shape of the linear parts of petroglyphs". En Rupestre/web, https://rupestreweb.tripod.com/urbani.html
---------------------------------------- COMENTARIO ----------------------------------------
Por Pedro Argüello G. Universidad Nacional de Colombia:
El texto del profesor Urbani propone el uso de mediciones detalladas y de análisis estadísticos con el fin de encontrar diferencias significativas entre petroglifos, las cuales no son observables por medio de un registro sencillo y macro-visual del arte rupestre. En primer lugar, cabe destacar que el autor presenta sus resultados en términos de las diferencias constatables a partir de las mediciones y análisis, sin llevar a cabo las tradicionales interpretaciones que a partir del estilo se hacían para el arte rupestre de América del Sur. Es decir, la diferencia entre las dos figuras estudiadas, aunque se presenta como posibilidad, no es interpretada en términos de diferentes períodos de ejecución, tradiciones distintas o reemplazo de unos pueblos por otros. En segundo lugar, y a pesar de la pequeña muestra que compone el estudio, es un buen ejemplo de cómo los análisis de tipo cuantitativo brindan resolución al momento de evaluar figuras rupestres presentes incluso en la misma roca. Lo cual es importante debido a la tendencia a entender los paneles grabados y pintados como un solo texto o como un conjunto unificado. No obstante, el análisis hecho a partir de mediciones de las dimensiones de los surcos de dos petroglifos no tiene en cuenta un elemento fundamental: los procesos erosivos que pueden haber afectado de manera importante las dimensiones originales de los surcos. Teniendo en cuenta que las medidas presentadas están dadas en milímetros, se puede sospechar entonces que la disparidad, por ser mínima, se puede presentar por fenómenos diferentes a una elección cultural inicial. Aunque es un hecho que las dos figuras están ubicadas en la misma roca, es también sabido que los procesos erosivos intervienen de manera diferencial, aunque la dureza de la roca de edad precámbrica impida que esos procesos operen con facilidad. En conclusión, un estudio tan detallado como el realizado por el profesor Urbani debe ser complementado por observaciones referentes a los procesos que pudieron contribuir a la modificación de la figura original. En arqueología, actualmente las investigaciones dedican importantes esfuerzos en lo que se ha llamado los procesos de formación de sitio, en donde se analiza de manera paralela las modificaciones producidas tanto por agentes naturales como culturales. Estos desarrollos, que son utilizados fundamentalmente al momento de evaluar las dataciones que se realizan en arte rupestre, deben también ser incluidos dentro de las explicaciones que se hacen en lo referente a las características distintivas de las figuras. Con lo cual puede acaecer que las grandes y atractivas explicaciones, basadas en diferencias en la técnica de elaboración de las figuras rupestres, pueden ser puestas en cuestión a partir de análisis pormenorizados como los llevados a cabo por el profesor Urbani. Lo que finalmente obliga a los investigadores a observar un cada vez mayor abanico de posibilidades explicativas, producto de un refinamiento en la concepción, manejo y comprensión de los datos. P.A.G.
[Rupestre/web Inicio] [Artículos] [Noticias] [Zonas] [Vínculos] [Publique]
|
||||||||||||||||||||||||||||||||||||||||||||||||||||||||||||||||||||||||||||||||||
|
|
